
Customers Count — Teacher Guide
Directions
Group Work
In this project students will work in groups to:
- design and conduct a survey that will generate categorical and numerical data; and
- tally the data from the survey.
You may want to assign students to groups and introduce the project a few days in advance to give students a chance to think about the project.
Materials Needed and Additional Directions
Planning the Survey
Students will access the directions and four survey scenarios online. Students will complete the Market Research Survey template and the Data Collection plan online. One student in each group should be responsible for typing the survey and the data collection plan.
The teacher should read and approve each survey and data collection plan for viability, accuracy, and appropriateness. Teachers should verify that the survey questions are likely to produce usable data.
Conducting the Survey
After all surveys are approved, provide each group with 40 copies of the survey. Allow students sufficient time to conduct the survey.
Initial Data Analysis
Each group will need multiple paper copies of the tally sheet (1 per question). Note there are different tally sheets for numerical and categorical data.
The teacher should check the tallies and approve data sets that are appropriate for the final report. Each student will need a copy of the final tallies.
Final Report
Individually, students use the template and guiding questions to prepare a final report. Students will need access to their tally sheets to complete the final report.
Students may use graph paper to create graphs of their data, or they may use the tools provided in the final report template.
To use the online graphing tools, students must first use the data table tool to create a table. Note: To set the number of columns and row, click “View Controls.” After setting the number of rows or columns, hit the TAB key.
The following table summarizes possible data for the question, “On a typical weekday, about how many hours do you spend watching TV?”
# of Hours of TV | # of People |
0 | 1 |
1 | 4 |
2 | 9 |
3 | 11 |
4 | 8 |
5 | 2 |
6 | 3 |
7 | 1 |
8 | 0 |
9 | 1 |
10 | 1 |
The graphing tools summarize the data for ONE column within the data table. Rather than creating standard summary tables such as the one above, students must create tables that list each data point. Since four people indicated they watch one hour of TV, “1” must be entered four times in the table.
# Hours | # of People |
0 | 1 |
1 | 1 |
1 | 1 |
1 | 1 |
1 | 1 |
2 | 1 |
2 | 1 |
2 | 1 |
2 | 1 |
2 | 1 |
2 | 1 |
2 | 1 |
2 | 1 |
2 | 1 |
3 | 1 |
3 | 1 |
3 | 1 |
3 | 1 |
3 | 1 |
3 | 1 |
3 | 1 |
3 | 1 |
3 | 1 |
3 | 1 |
3 | 1 |
4 | 1 |
4 | 1 |
4 | 1 |
4 | 1 |
4 | 1 |
4 | 1 |
4 | 1 |
4 | 1 |
5 | 1 |
5 | 1 |
6 | 1 |
6 | 1 |
6 | 1 |
7 | 1 |
9 | 1 |
10 | 1 |
Additional Note:
The histogram tool excludes the lower limit and includes the upper limit for each range (i.e., an observation on the border goes in the lower bin). For data sets than include one or more zero values, the histogram will be slightly off.

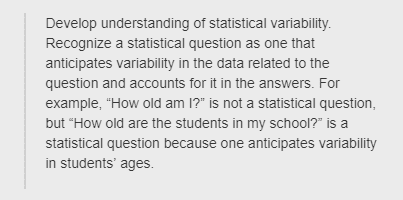
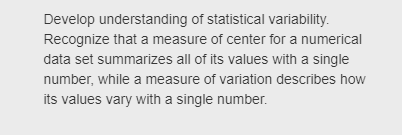
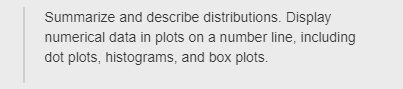
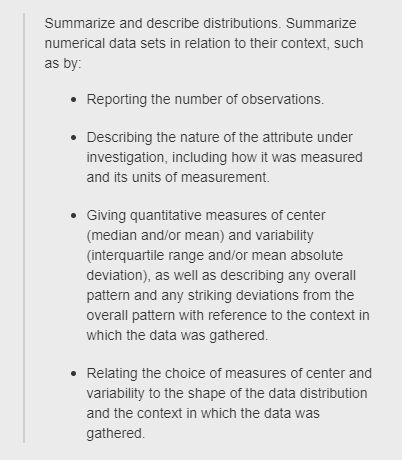
Standards

Student Materials
Teacher Materials


